The Always-On Tax: How After-Hours Work Signals Engineering Burnout
Velocity looks fine, until your best engineers quit. Learn what engineering leaders on Reddit say about after-hours commits, weekend work and burnout at enterprise scale, and how Keypup MCP uses commit, review and merge timestamps to measure how much work happens outside working hours, where it concentrates, who is overloaded without naming anyone, and what it costs in skipped reviews.
Liam Davis
•13 min read
Table of Contents
TL;DR: Burnout rarely shows up in delivery metrics until it shows up as resignations. What shows up first is when people work: commits at 22:00, reviews on Sunday evening, pull requests merged on Saturday. This is the always-on tax — capacity borrowed from evenings and weekends that the roadmap quietly depends on. The Keypup MCP Server reads the timestamp of every commit, review and pull request merge from your Git platforms. Your AI assistant can then measure the share of work done outside working hours, see when it happens, track it month by month, find the repositories where it concentrates, spot overload patterns without ranking individuals, and show the review shortcuts that late-night merges take.
Ask an engineering organization whether its pace is sustainable and the answer will be "yes, mostly". Ask what share of its code is written after 19:00 or at the weekend, and nobody knows — because no delivery dashboard measures it.
The Friction: Overtime Nobody Sees
In a team of eight, a manager notices the engineer who answers messages at midnight. In an organization of 1,500 engineers across 250 repositories and several time zones, after-hours work is invisible for structural reasons:
Delivery metrics reward it. Throughput and cycle time improve when people work evenings. The dashboard turns greener as the team gets more tired.
Engagement surveys are slow and lagging. A twice-a-year survey reports burnout months after it started, averaged across hundreds of people.
Nobody tracks hours. Salaried engineers don't log time, and nobody wants to introduce time tracking.
The cost lands later. Burnout shows up as attrition, sick leave, incidents and the slow loss of the people who know the critical systems.
The result: leadership learns that a team was overloaded during the exit interview of its strongest engineer.
Why This Matters: The Real Cost of the Always-On Culture
The Retention Problem
Replacing a senior engineer costs months of salary in hiring and ramp-up, and their system knowledge often leaves with them. Sustained after-hours work is one of the earliest visible signs that a team is running beyond its capacity.
The Quality Problem
Work done late at night or at the weekend is usually done alone and under pressure. Pull requests merged outside working hours are more likely to skip the review that would have caught the problem.
The Planning Problem
If a roadmap is only met because people work evenings, the organization's real capacity is lower than its plans assume. Every quarter planned on that basis borrows more time from the next one.
The Enterprise Discussion: What Engineering Leaders Are Actually Saying
Burnout, crunch and "always-on" expectations are among the most recurring topics wherever staff engineers, engineering managers and directors at large organizations compare notes. The quotes below are representative of recurring threads on r/ExperiencedDevs, r/EngineeringManagers, r/cscareerquestions and r/cto.
"Our velocity was the best it had ever been. Then two of my senior engineers resigned in the same month, and in the exit interviews both said they'd been working most Sunday evenings for half a year to keep the release on track. None of our metrics showed it."
"Nobody ever asks us to work weekends. The deadlines just assume it. Every quarter end is a crunch, and every quarter the 'normal' after the crunch is a bit closer to the crunch."
Director of Engineering, Logistics Group (r/cto)
"I don't want to monitor people's hours, and I definitely don't want a leaderboard of who commits at midnight. But I need some signal of which teams are overloaded before HR tells me about it in the attrition report."
The pattern holds: leaders know overload exists, but they only discover where it is through resignations — and they are rightly wary of any measurement that feels like surveillance.
How Keypup MCP Measures the Always-On Tax
The Keypup Model Context Protocol (MCP) Server gives your AI assistant structured access to the data Keypup imports from GitHub, GitLab, Bitbucket and Azure DevOps. For this analysis, three timestamps matter: the creation date of each commit attached to a pull request, the submission date of each pull request review, and the merge date of each pull request — along with the author, repository, lines changed, approval count and review dates of each pull request.
In the prompts below, outside working hours means before 08:00 or from 19:00 on weekdays, or any time on Saturday and Sunday, in Central European Time (CET). Pick the hours and time zone that match each team. The goal is to measure teams and repositories, not to rank individuals.
1. Running an Always-On Health Check
The first question is simple: how much work happens outside working hours?
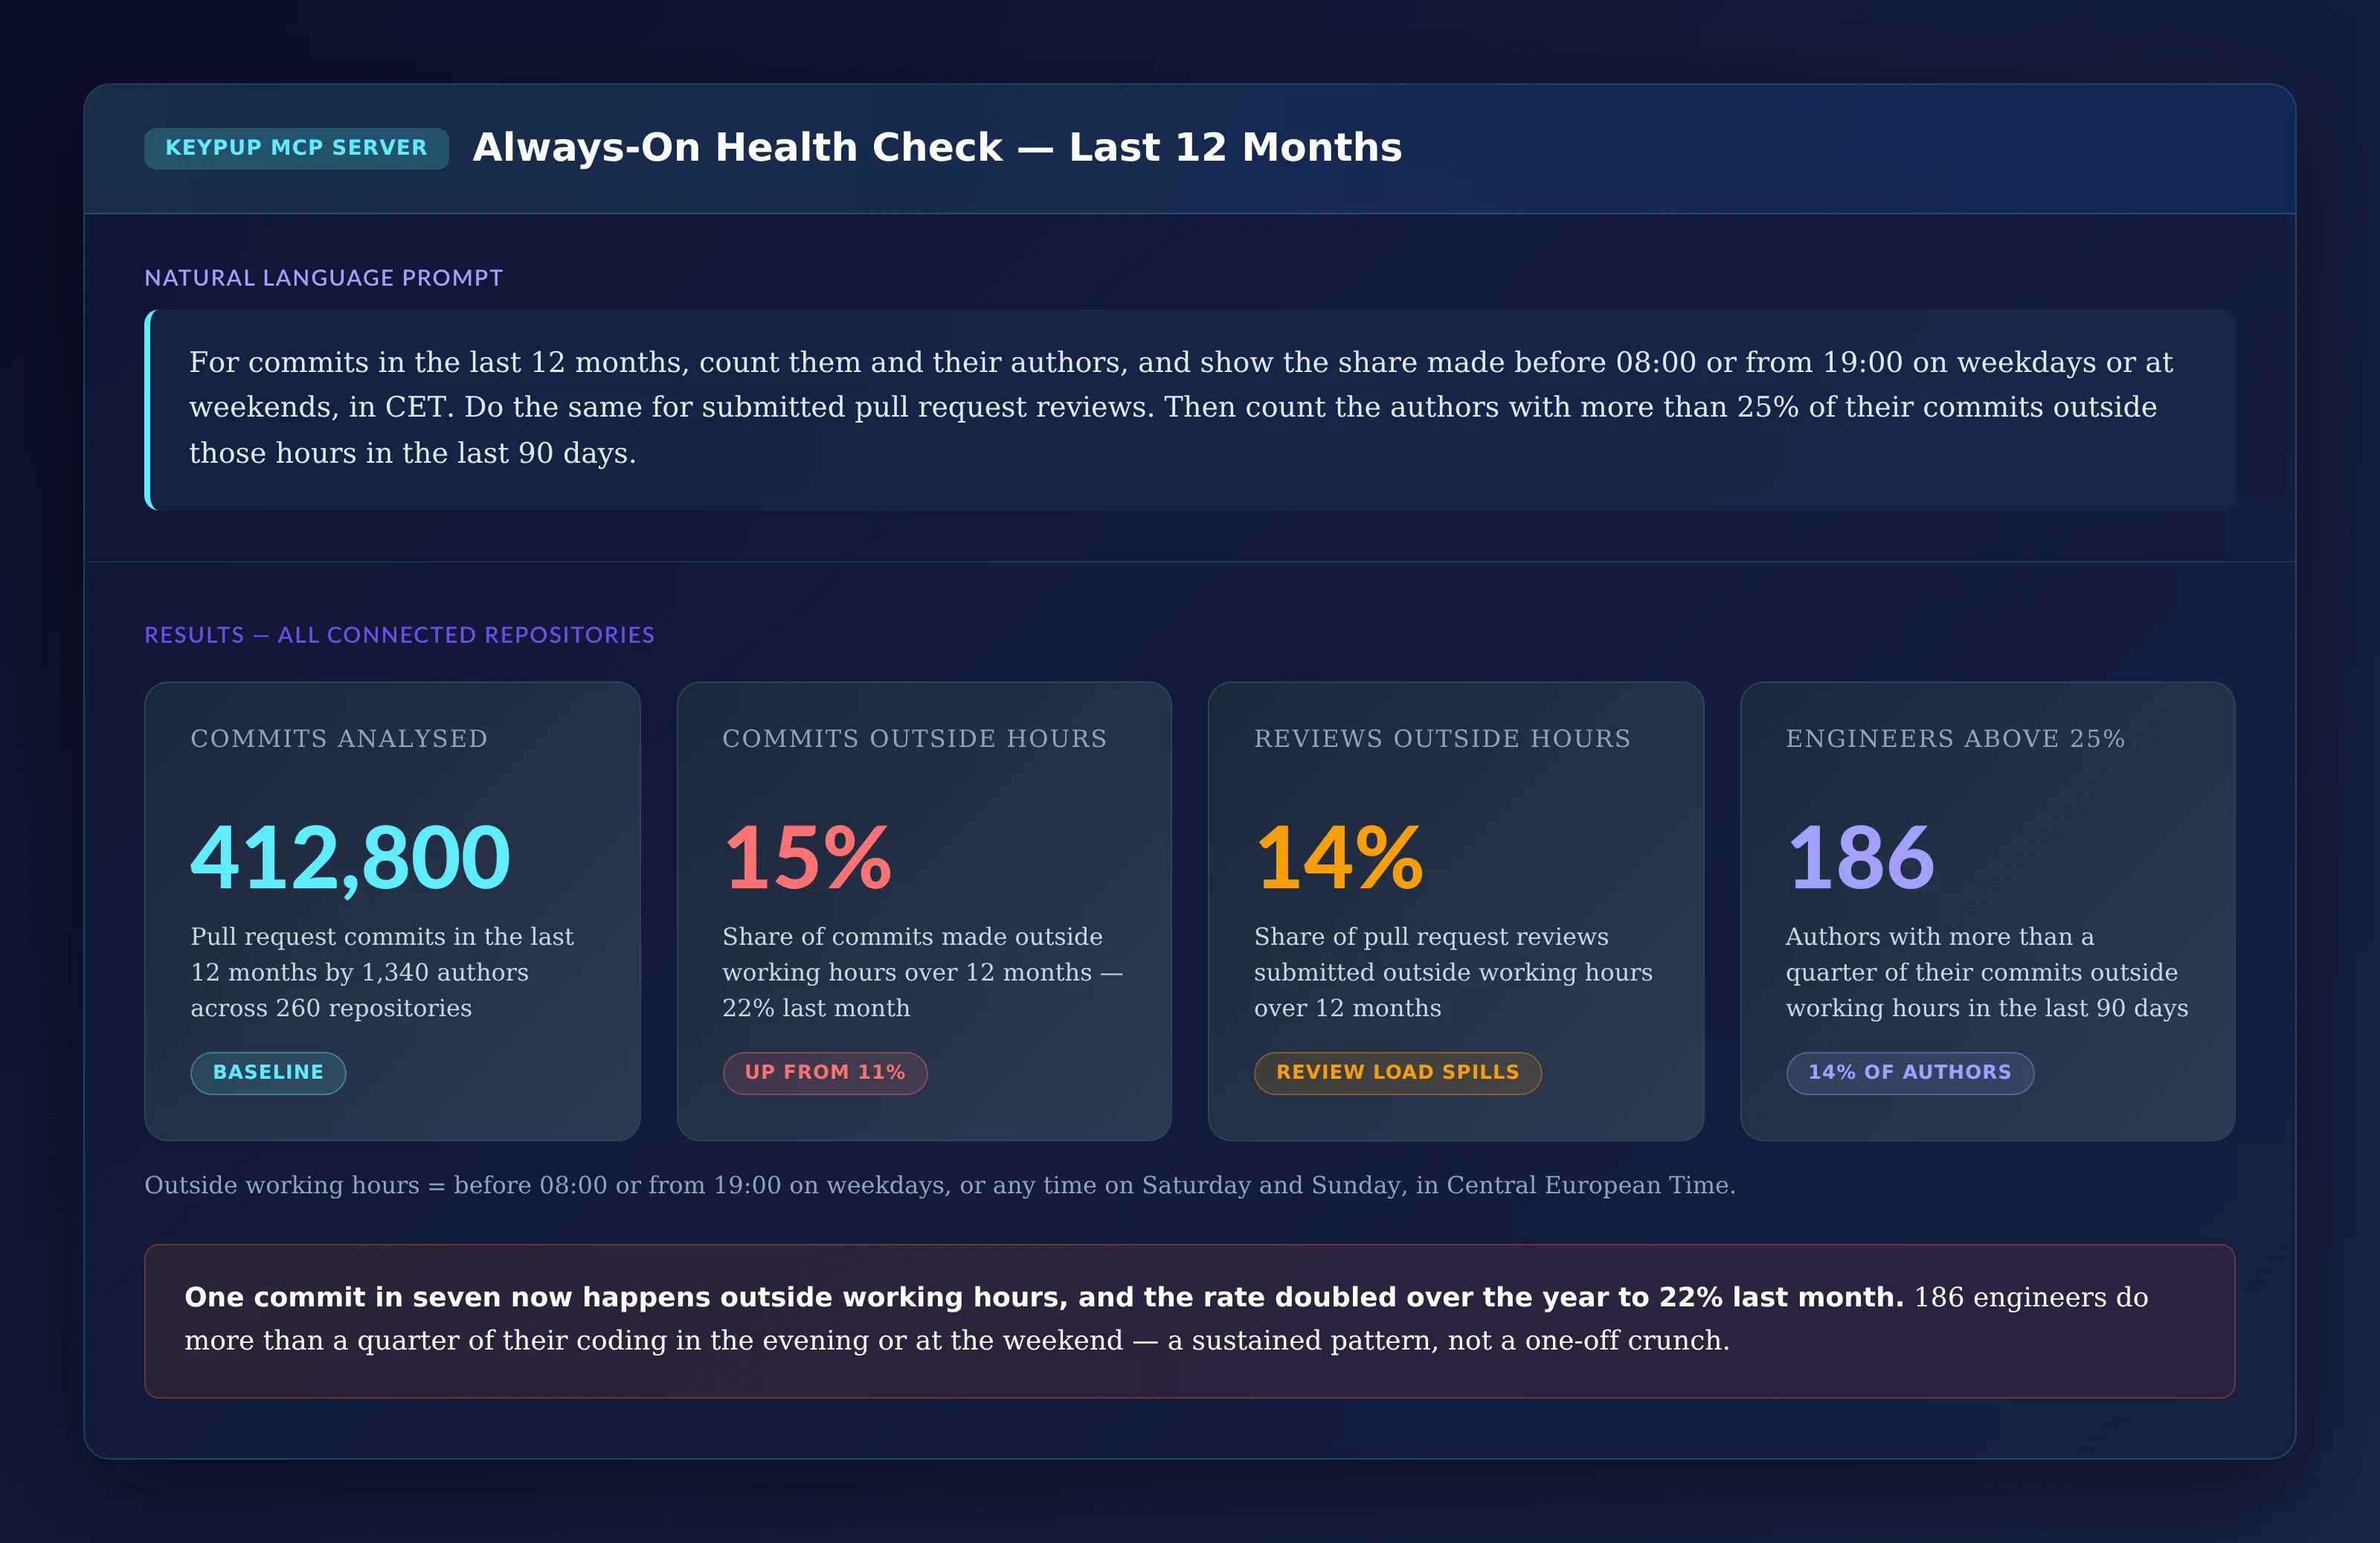
MCP Prompt:
For commits in the last 12 months, count them and their
authors, and show the share made before 08:00 or from 19:00
on weekdays or at weekends, in CET. Do the same for submitted
pull request reviews. Then count the authors with more than
25% of their commits outside those hours in the last 90 days.
Output: Always-On Health Check — Last 12 Months
Key Insight: One commit in seven now happens outside working hours, and the rate doubled over the year to 22% last month. 186 engineers do more than a quarter of their coding in the evening or at the weekend — a sustained pattern, not a one-off crunch.
2. Seeing When the Work Actually Happens
A percentage is one number. A punch card shows when the extra hours are worked.
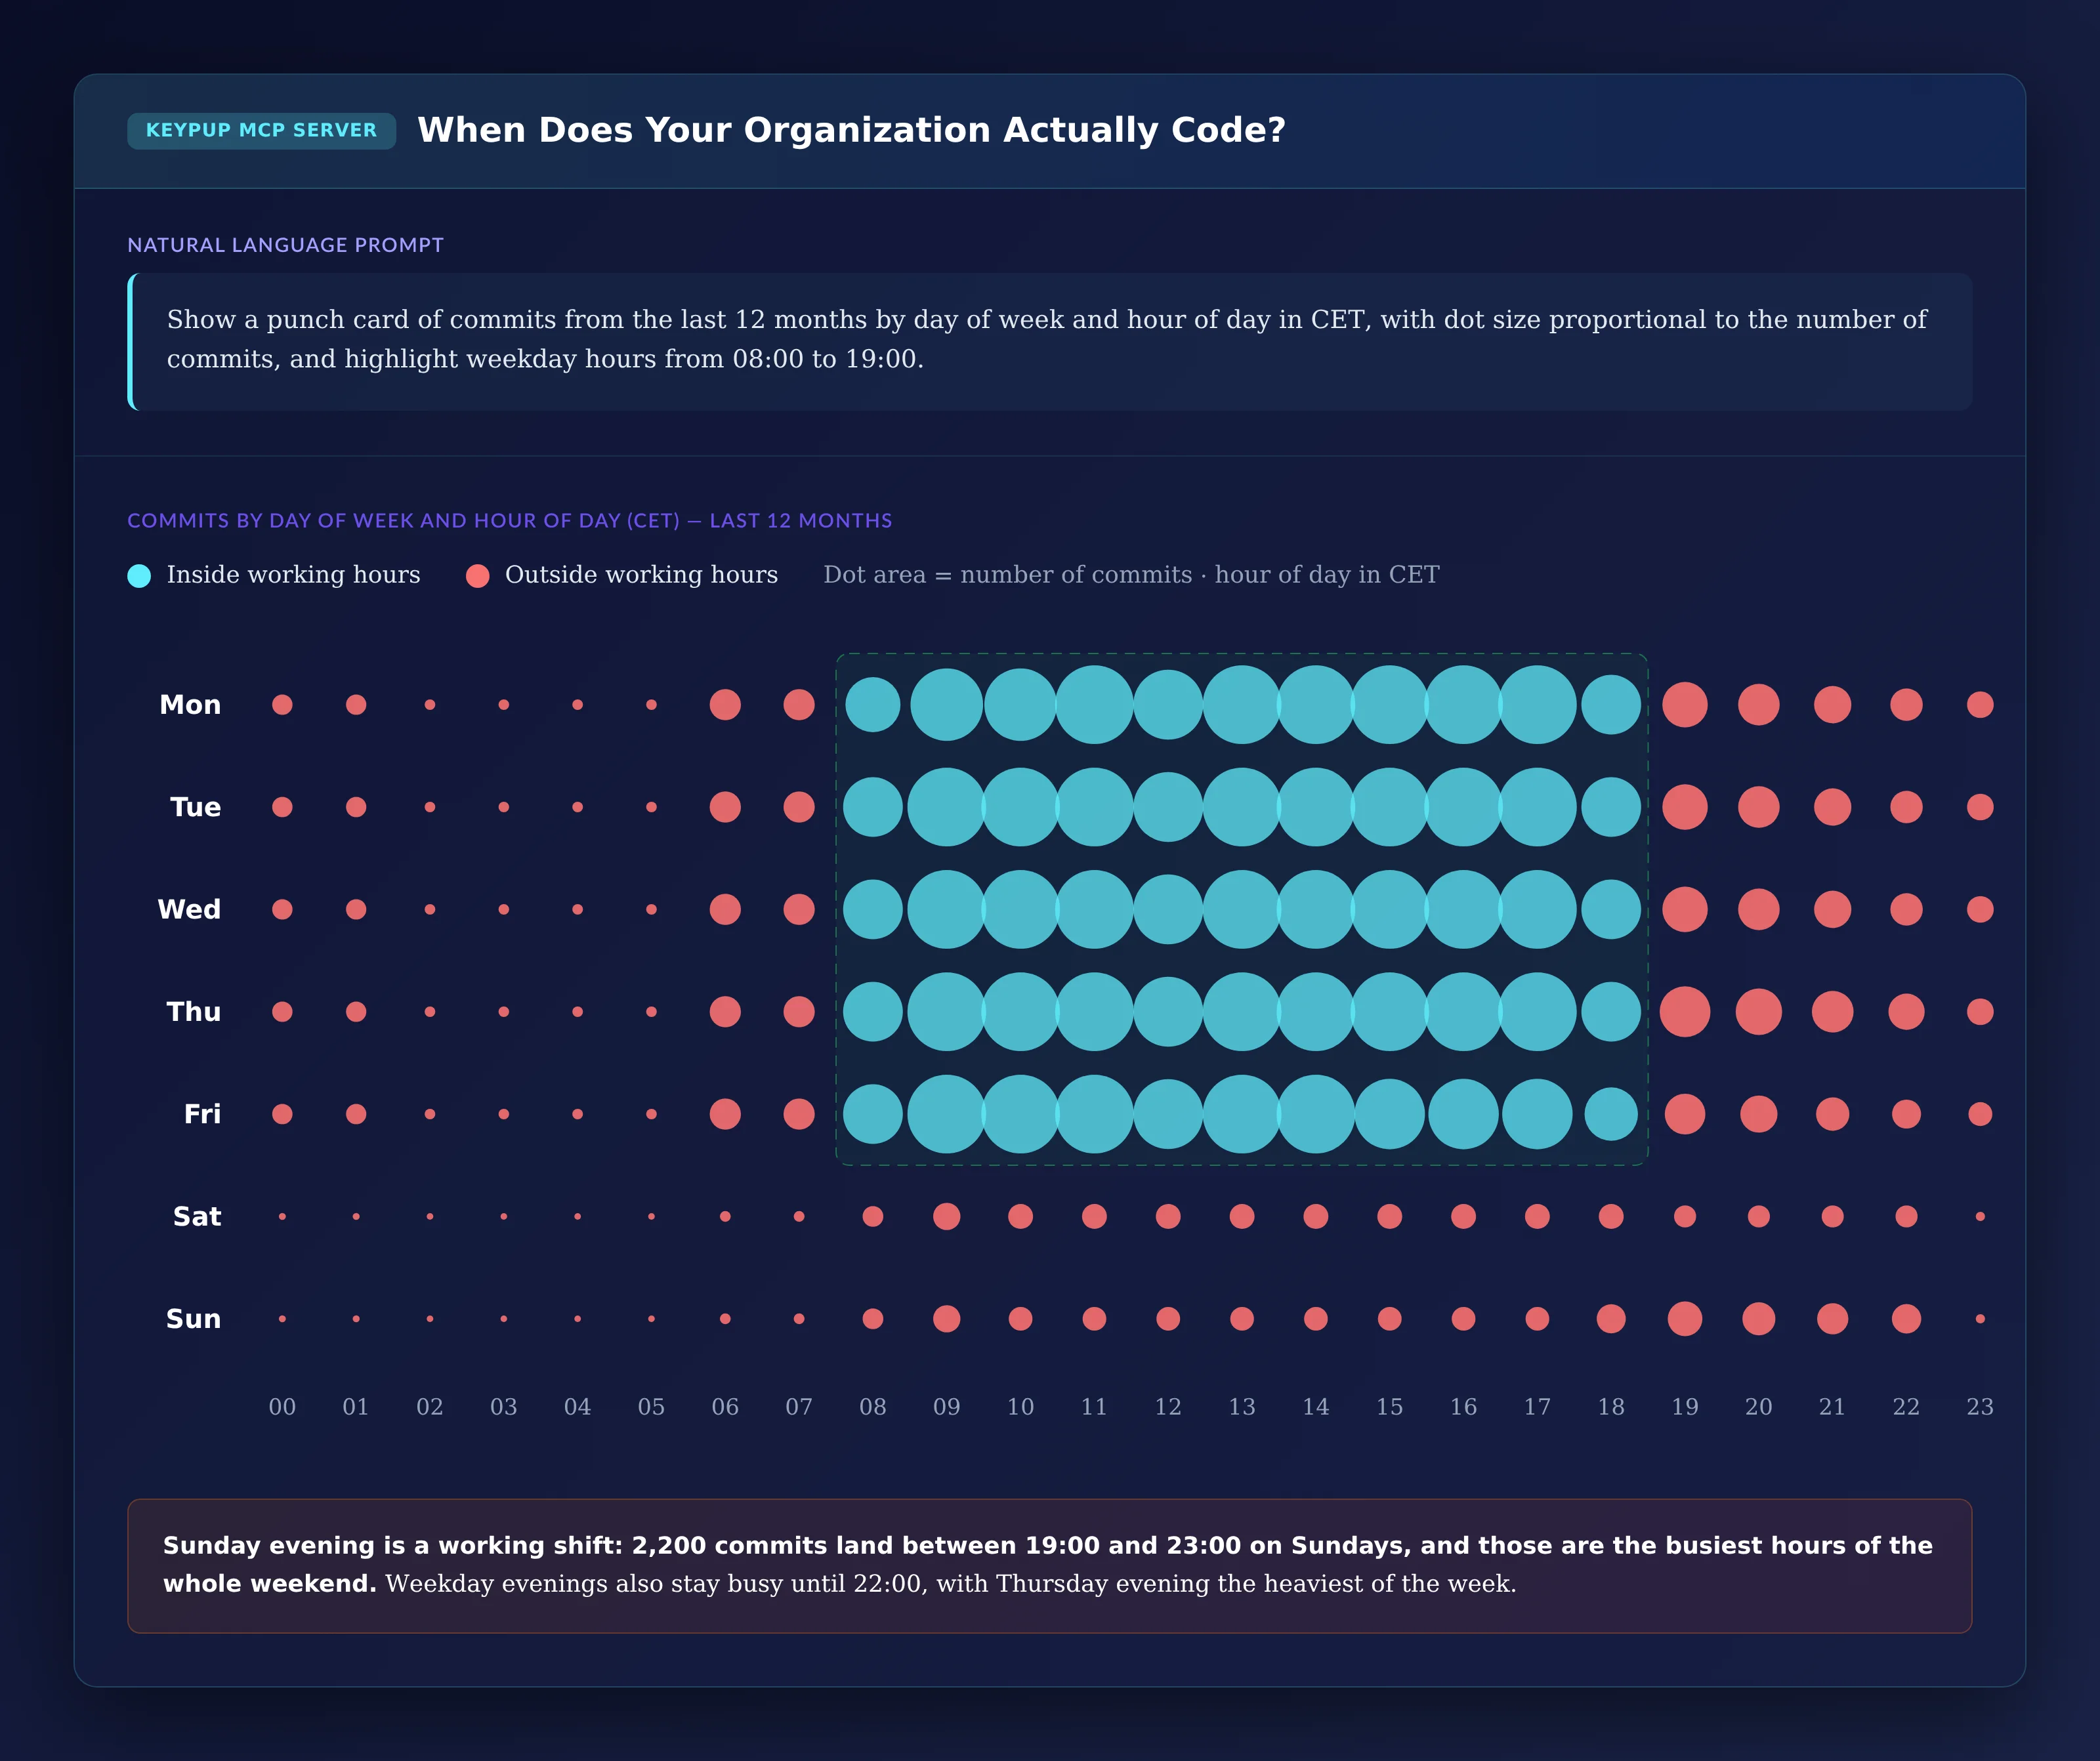
MCP Prompt:
Show a punch card of commits from the last 12 months by day
of week and hour of day in CET, with dot size proportional to
the number of commits, and highlight weekday hours from 08:00
to 19:00.
Output: When Does Your Organization Actually Code?
Key Insight: Sunday evening is a working shift: 2,200 commits land between 19:00 and 23:00 on Sundays, and those are the busiest hours of the whole weekend. Weekday evenings stay busy until 22:00, with Thursday evening the heaviest of the week.
3. Tracking the Trend Month by Month
Is after-hours work a one-off crunch or the new normal? A monthly trend answers that.
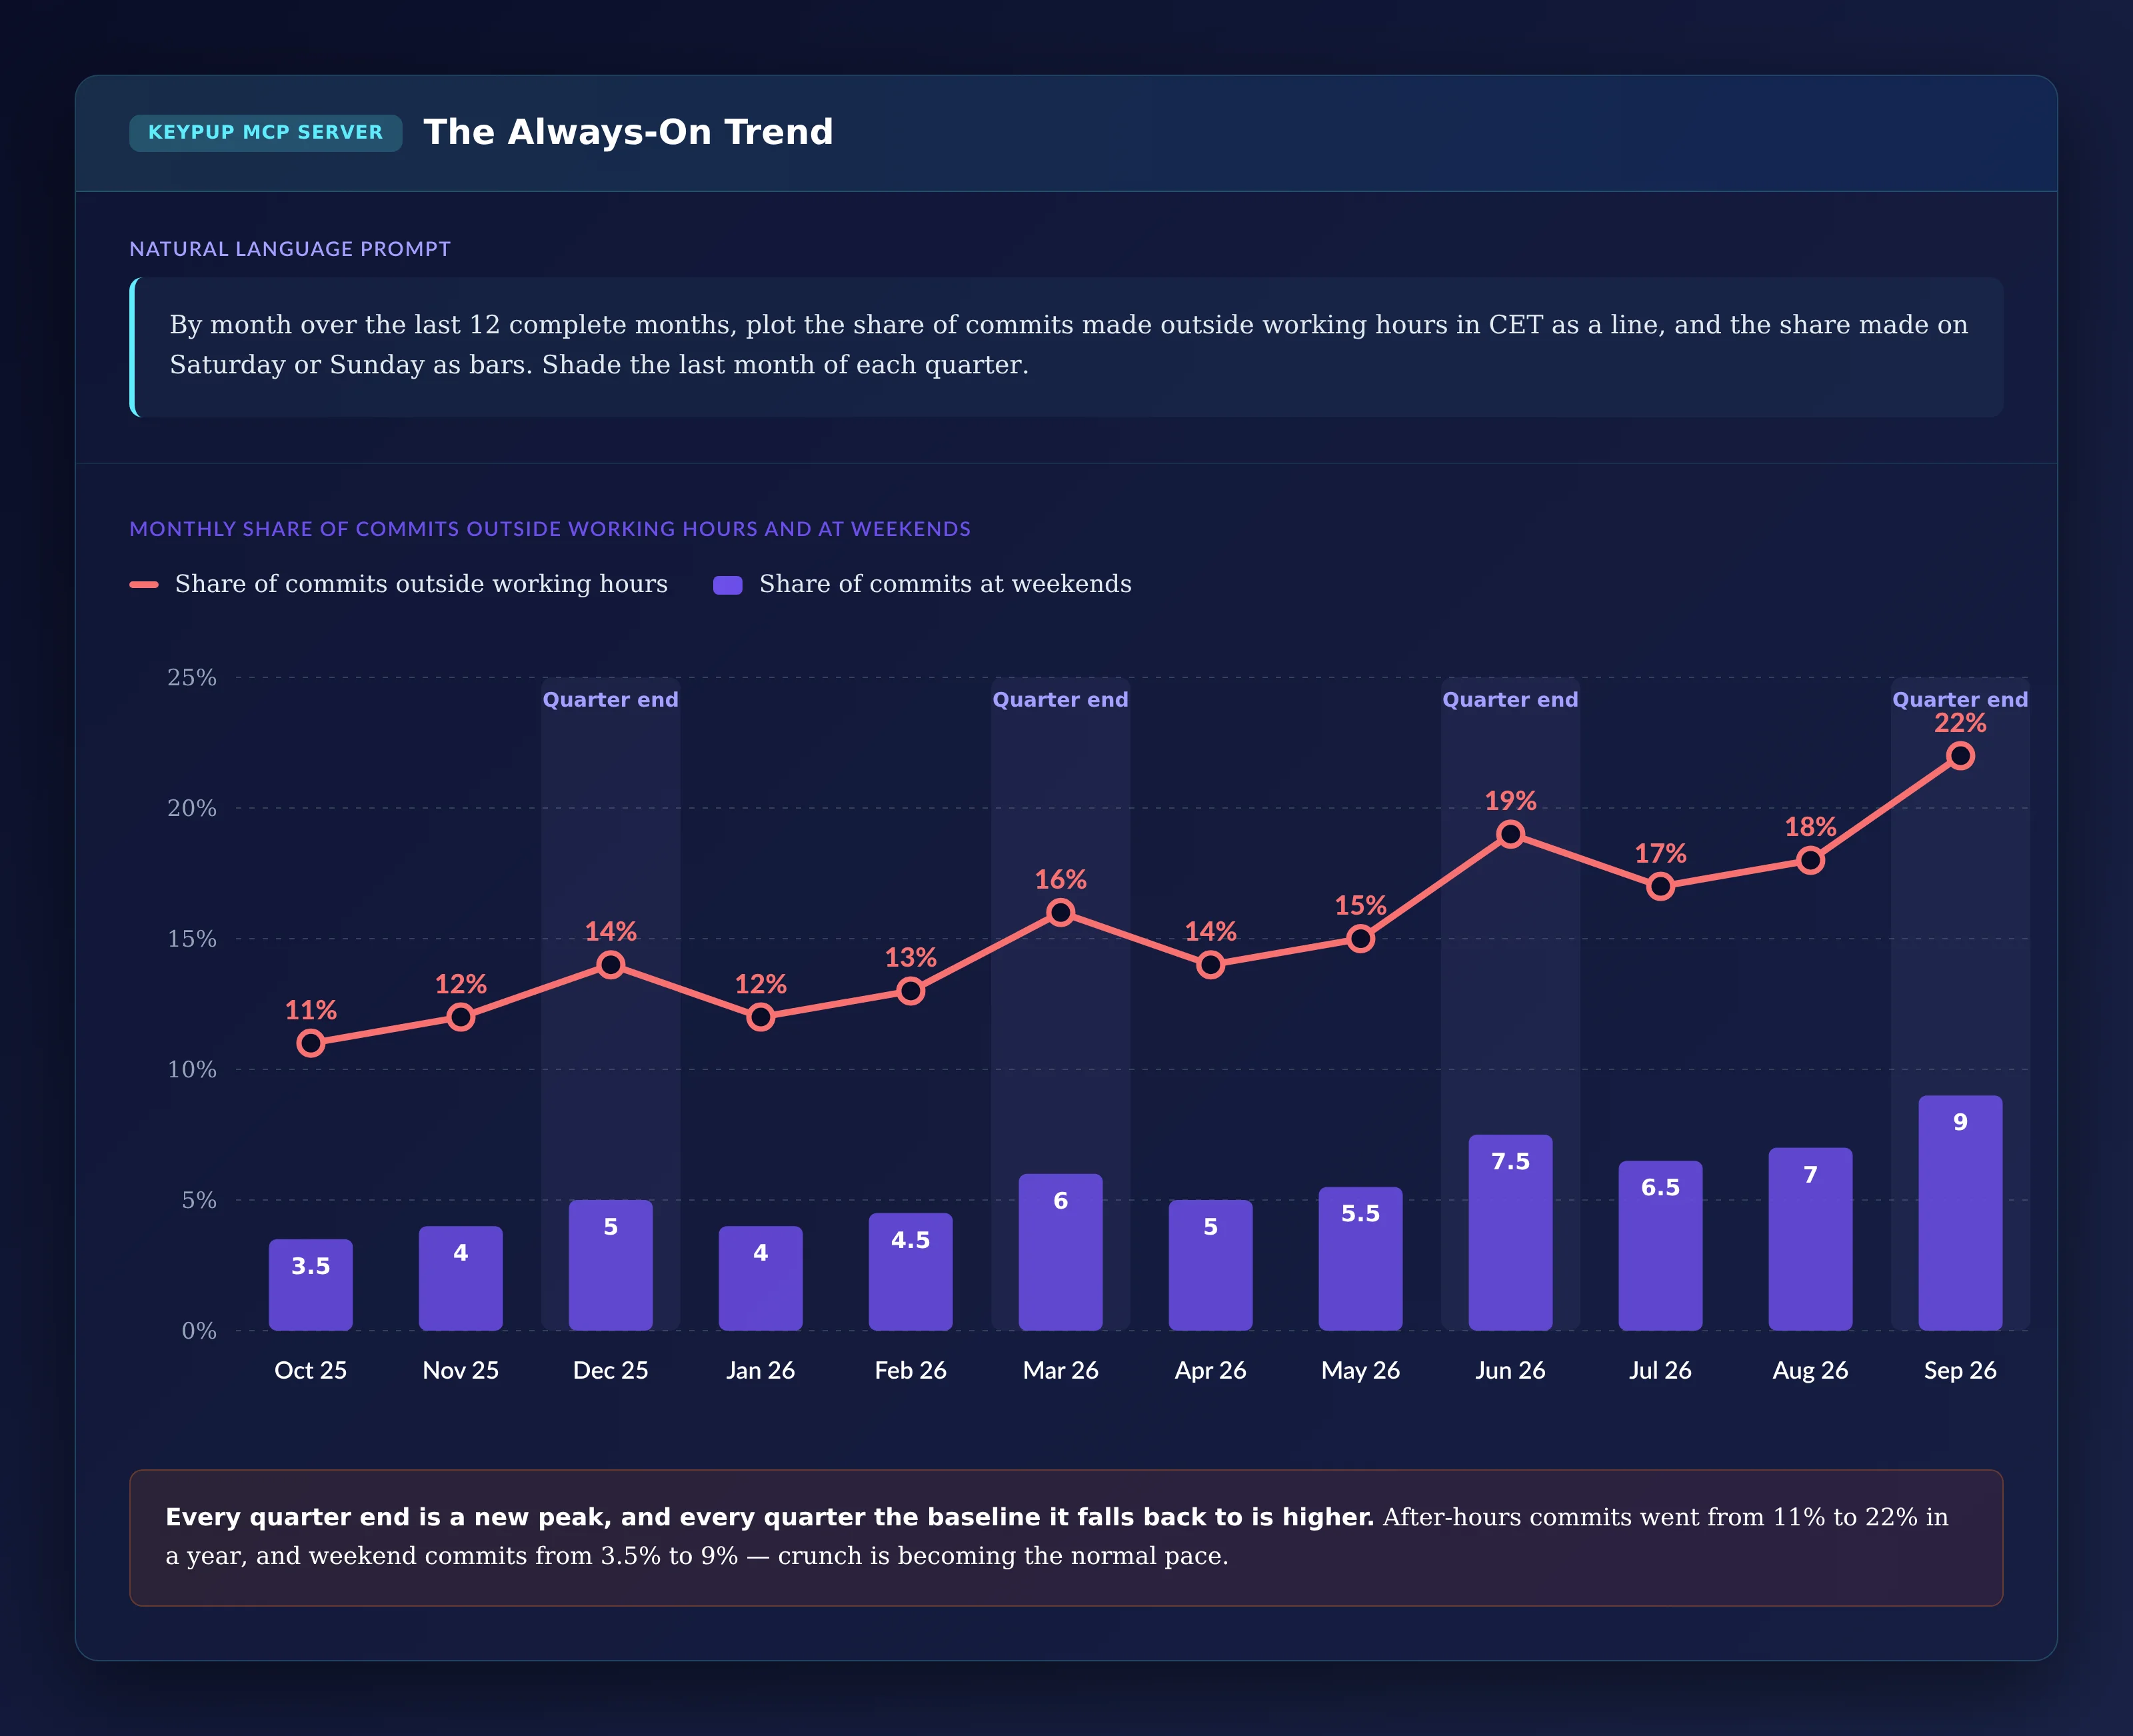
MCP Prompt:
By month over the last 12 complete months, plot the share of
commits made outside working hours in CET as a line, and the
share made on Saturday or Sunday as bars. Shade the last month
of each quarter.
Output: The Always-On Trend
Key Insight: Every quarter end is a new peak, and every quarter the baseline it falls back to is higher. After-hours commits went from 11% to 22% in a year, and weekend commits from 3.5% to 9% — crunch is becoming the normal pace.
4. Finding Where the Work Spills Over
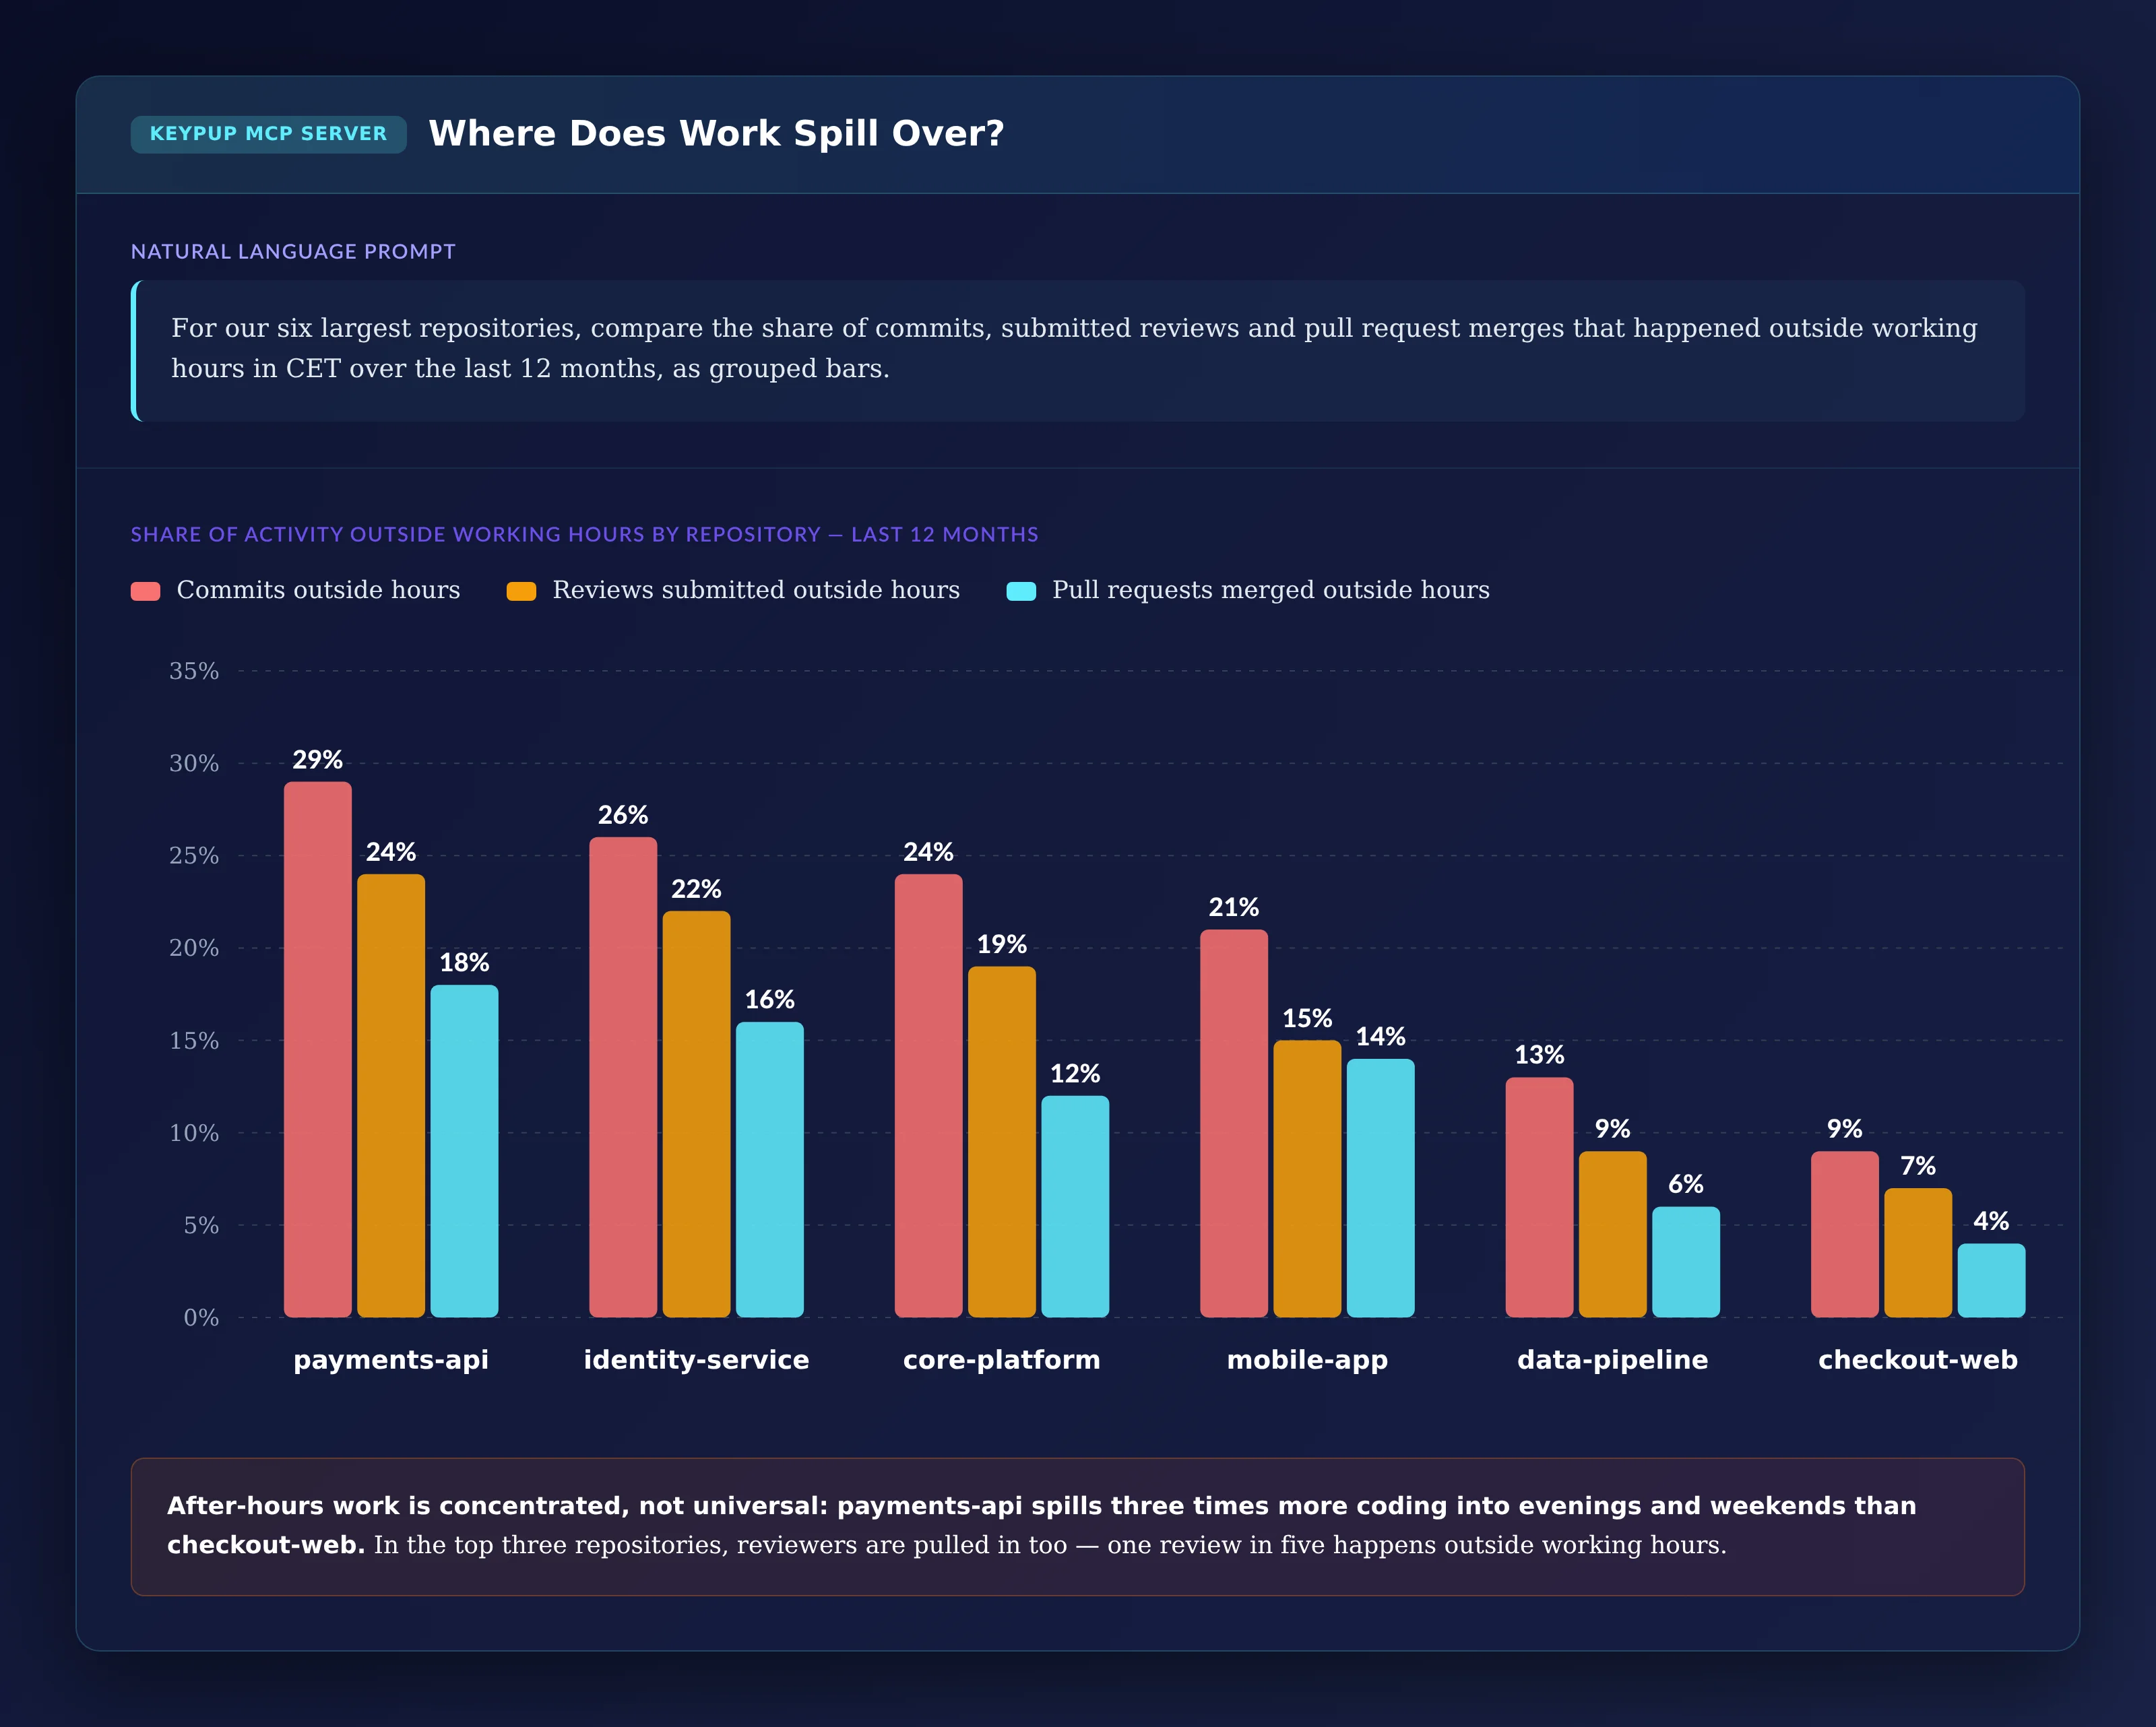
After-hours work is rarely spread evenly. Comparing repositories shows where it concentrates — and whether reviewers are pulled in too.
MCP Prompt:
For our six largest repositories, compare the share of commits,
submitted reviews and pull request merges that happened outside
working hours in CET over the last 12 months, as grouped bars.
Output: Where Does Work Spill Over?
Key Insight: After-hours work is concentrated, not universal: payments-api spills three times more coding into evenings and weekends than checkout-web. In the top three repositories, reviewers are pulled in too — around one review in five happens outside working hours.
5. Spotting Overload Without Naming Anyone
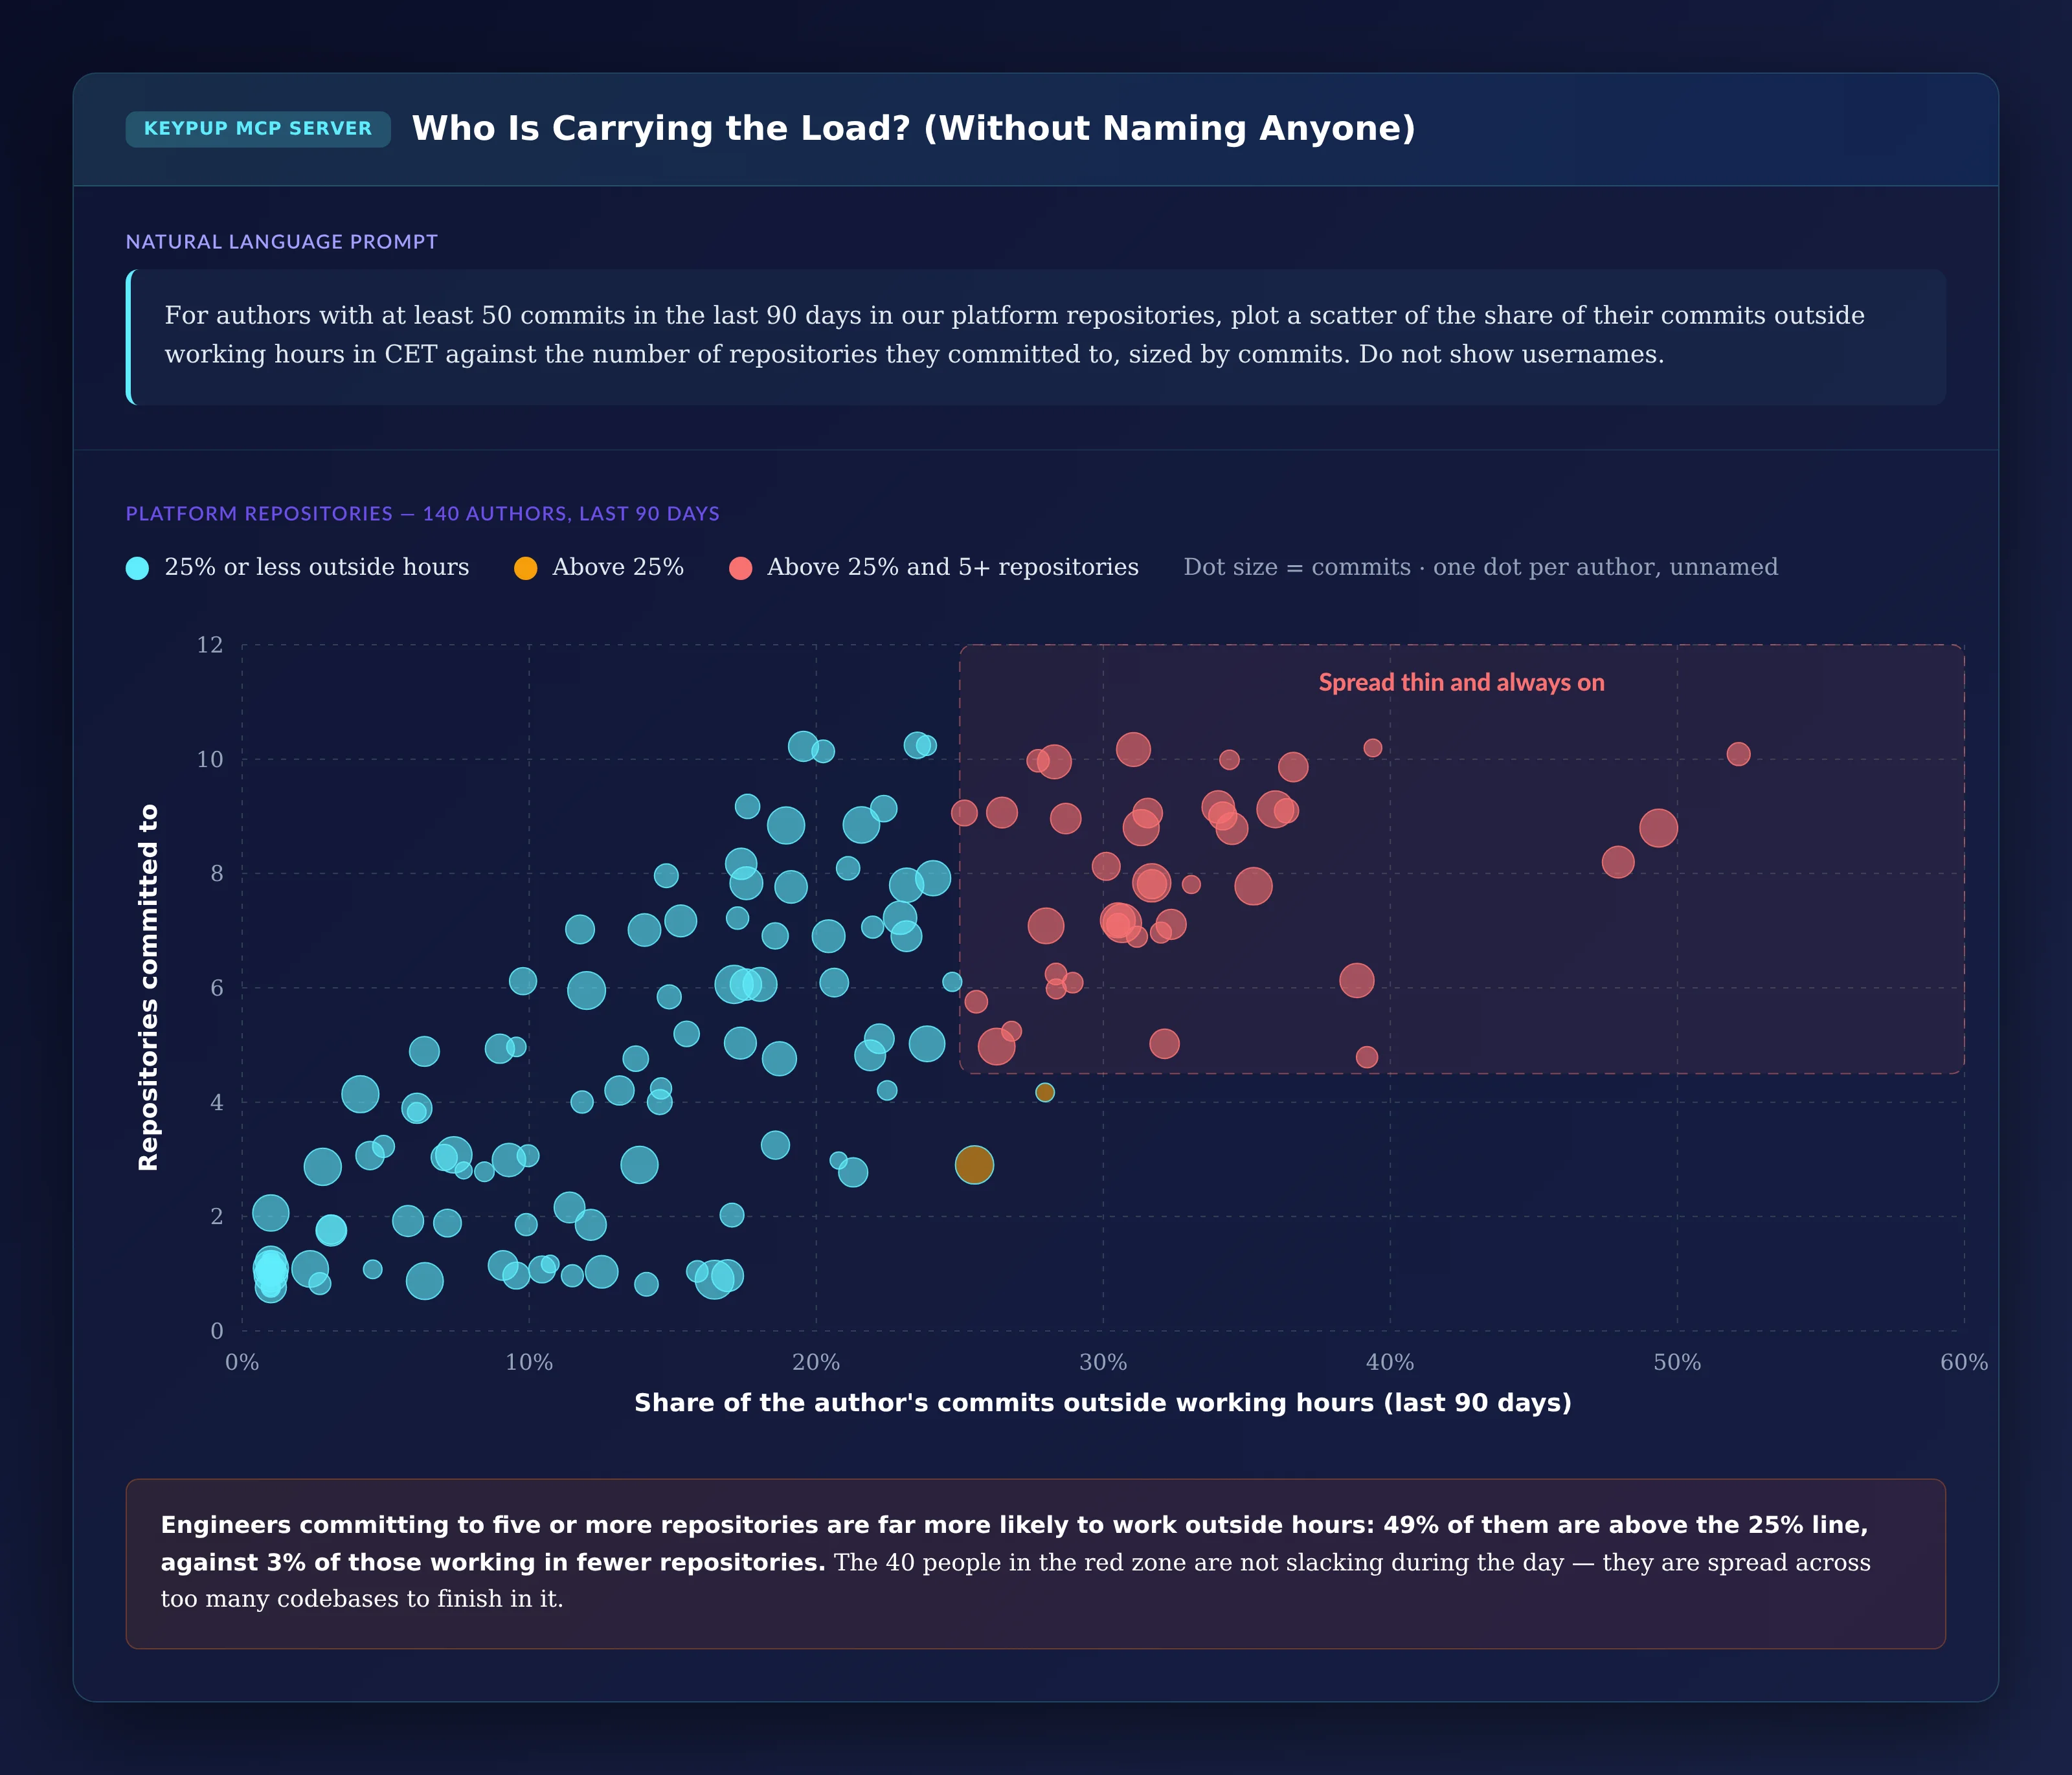
The most useful burnout signal is per person — and the most dangerous one to misuse. An anonymous scatter plot shows the pattern without creating a leaderboard. "Our platform repositories" assumes you've told your assistant which repositories each team owns (see step 3 of the implementation below).
MCP Prompt:
For authors with at least 50 commits in the last 90 days in
our platform repositories, plot a scatter of the share of their
commits outside working hours in CET against the number of
repositories they committed to, sized by commits. Do not show
usernames.
Output: Who Is Carrying the Load? (Without Naming Anyone)
Key Insight: Engineers committing to five or more repositories are far more likely to work outside hours: 49% of them are above the 25% line, against 3% of those working in fewer repositories. The 40 people in the red zone are not slacking during the day — they are spread across too many codebases to finish in it.
6. Showing What Late-Night Merges Skip
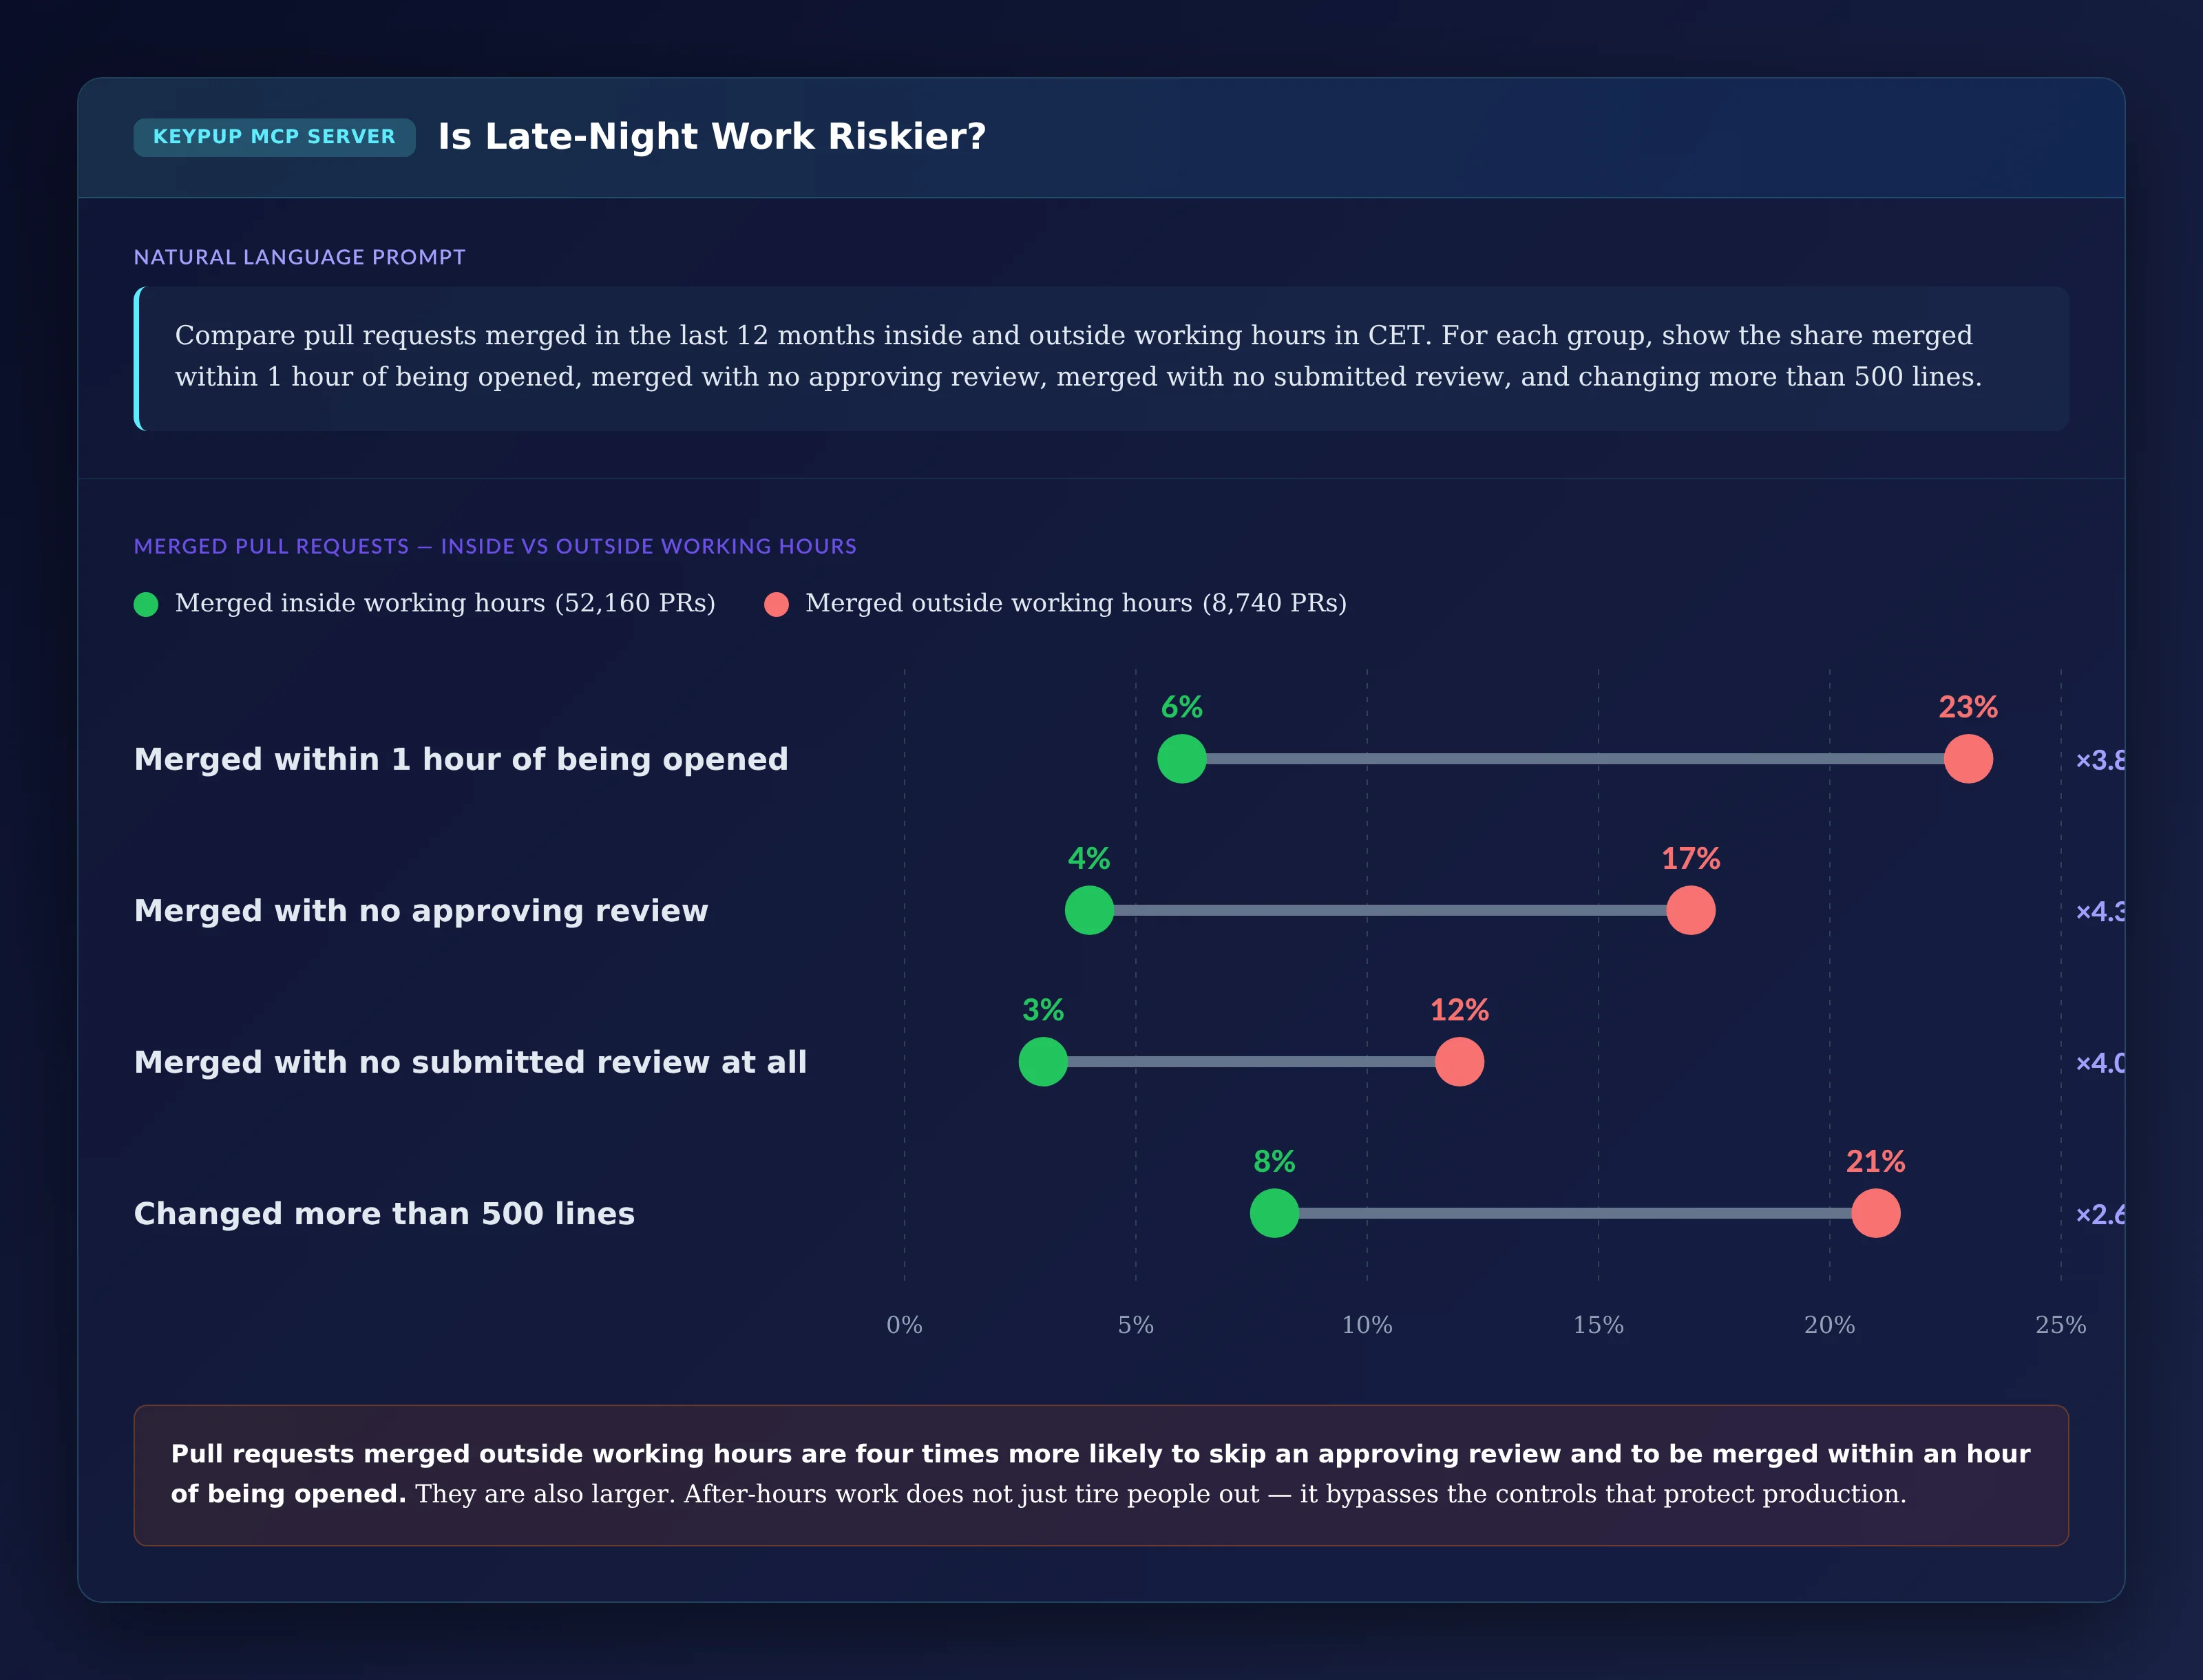
After-hours work isn't only a wellbeing issue. Comparing pull requests merged inside and outside working hours shows what it does to your controls.
MCP Prompt:
Compare pull requests merged in the last 12 months inside and
outside working hours in CET. For each group, show the share
merged within 1 hour of being opened, merged with no approving
review, merged with no submitted review, and changing more
than 500 lines.
Output: Is Late-Night Work Riskier?
Key Insight: Pull requests merged outside working hours are about four times more likely to skip an approving review and to be merged within an hour of being opened. They are also larger. After-hours work doesn't just tire people out — it bypasses the controls that protect production.
7. Building a Sustainable Pace Scorecard per Repository
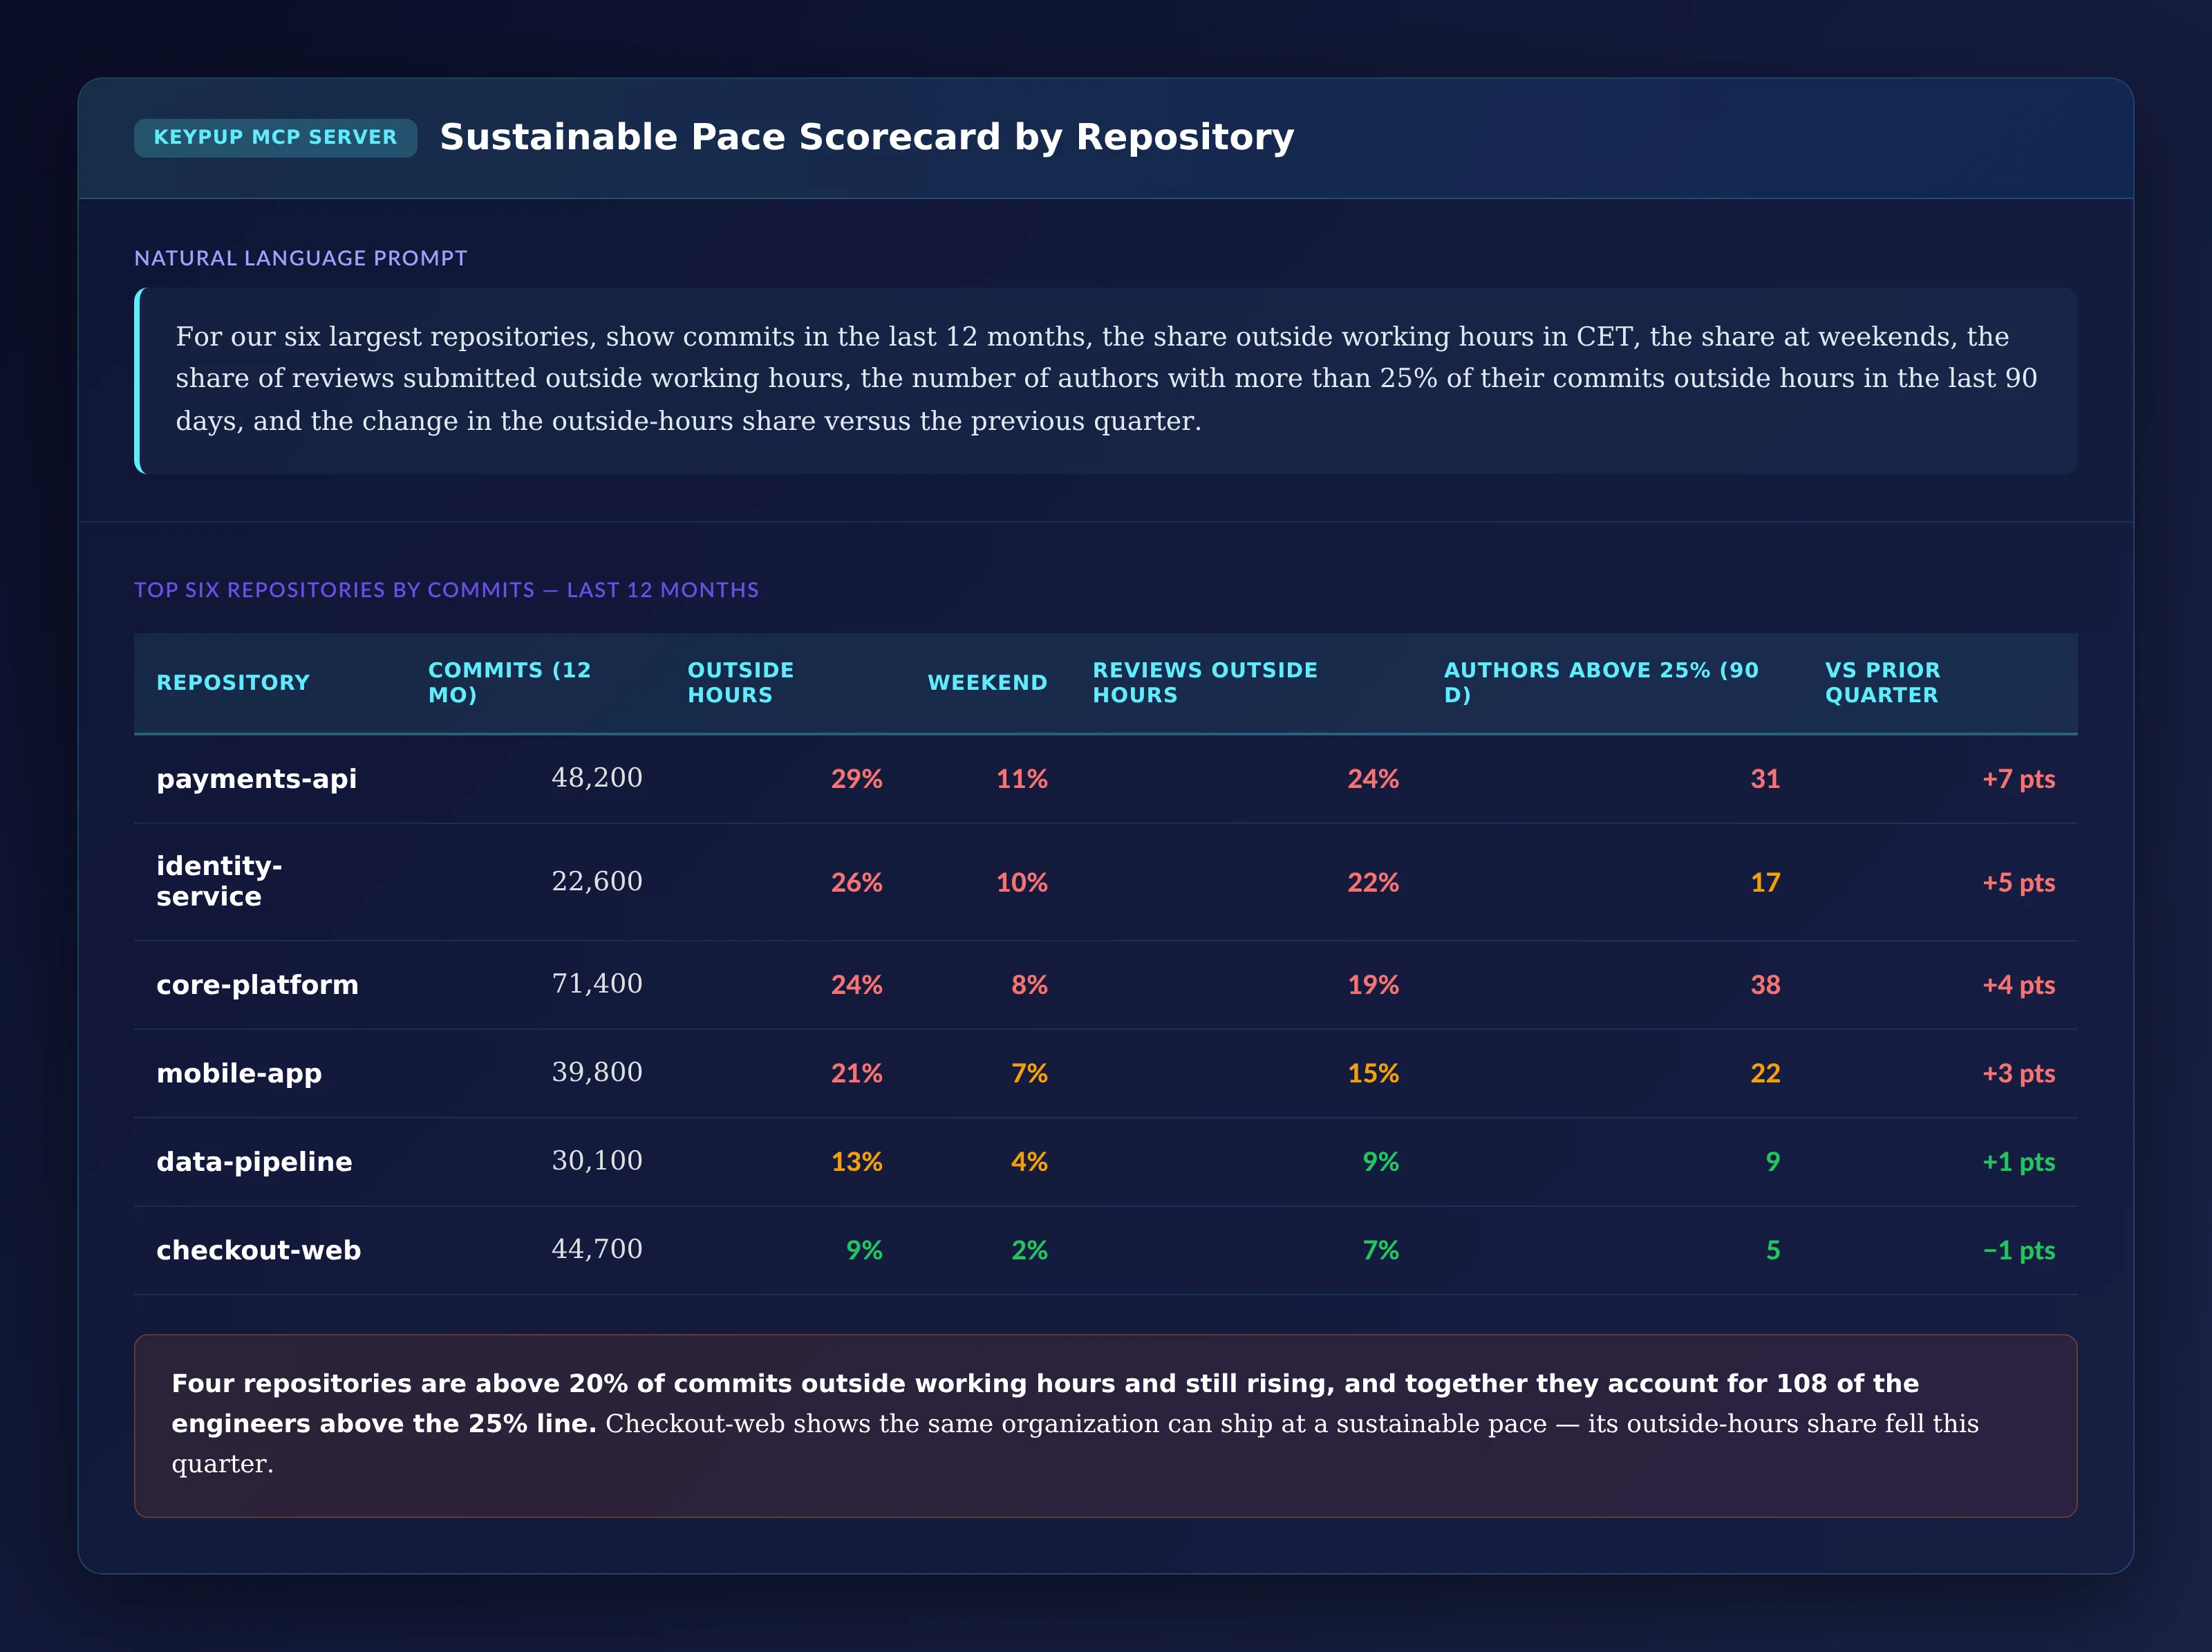
The last step turns the analysis into something each engineering manager can act on.
MCP Prompt:
For our six largest repositories, show commits in the last 12
months, the share outside working hours in CET, the share at
weekends, the share of reviews submitted outside working hours,
the number of authors with more than 25% of their commits
outside hours in the last 90 days, and the change in the
outside-hours share versus the previous quarter.
Output: Sustainable Pace Scorecard by Repository
Repository
Commits (12 mo)
Outside Hours
Weekend
Reviews Outside Hours
Authors Above 25% (90 d)
vs Prior Quarter
payments-api
48,200
29%
11%
24%
31
+7 pts
identity-service
22,600
26%
10%
22%
17
+5 pts
core-platform
71,400
24%
8%
19%
38
+4 pts
mobile-app
39,800
21%
7%
15%
22
+3 pts
data-pipeline
30,100
13%
4%
9%
9
+1 pt
checkout-web
44,700
9%
2%
7%
5
−1 pt
Key Insight: Four repositories are above 20% of commits outside working hours and still rising, and together they account for 108 of the engineers above the 25% line. Checkout-web shows the same organization can ship at a sustainable pace — its outside-hours share fell this quarter.
The Technical Implementation: What Keypup MCP Actually Reads
Every number above comes from timestamps Keypup already imports. It helps to be precise about what that data is — and what it isn't.
Commit Times Come From the Commits of Each Pull Request
Keypup imports the commits attached to pull requests, with their author, creation date, repository and lines changed. The hour of day and day of week are computed from the commit date. Commits pushed directly to a branch without ever being part of a pull request are not included, and the commit date is the one recorded by Git: if authors rewrite history with a rebase, the recorded time can differ from when the work was originally done.
Review and Merge Times Come From the Git Platform
Each pull request review carries its author and submission date, and each pull request carries its creation date, merge date, approval count, first review date and lines changed. That is what the merge risk comparison uses: "merged within an hour" compares the creation and merge dates, and "no approving review" uses the pull request's approval count.
Working Hours and Time Zones Are Defined in the Prompt
Timestamps are stored in UTC. The working-hours window and the time zone are applied in the prompt — Keypup's formula language supports hour-of-day, day-of-week and time-zone offsets. Keypup does not know where each engineer is located, so for distributed organizations, run the analysis per team or per repository with the time zone that team actually works in. Otherwise, a developer in Bangalore will look like they are always working "after hours" in CET.
Commits Are a Proxy, Not a Timesheet
A commit time shows when code was committed, not how long someone worked. Thinking, meetings and on-call work produce no commits, and some engineers simply prefer to work late. Treat these numbers as a team-level signal to start a conversation, never as an individual performance or attendance metric.
Overload Patterns Come From Grouping by Author
The scatter plot groups commits by author and counts the distinct repositories they committed to. The AI assistant can hide usernames in the output, as in prompt 5. Usernames are platform-specific, so one person with separate GitHub and GitLab accounts appears as two authors.
Real-World Impact: Enterprise Case Studies
Case Study 1: European Payments Provider
Before Keypup MCP:
900 engineers across 140 repositories
Regulatory release deadlines every quarter
Three senior engineers on the same core team resigned within two months
After Keypup MCP:
The monthly trend showed quarter-end crunches rising each quarter, with the baseline never returning to its earlier level
The repository scorecard pinpointed four repositories carrying most of the after-hours work, all owned by teams that had absorbed new compliance scope without new headcount
Two engineers were added and scope was re-planned for those teams; their outside-hours commit share fell from 27% to 14% over two quarters
"We had been reading our velocity as a sign of health. The after-hours trend showed it was borrowed time. We now review it every month alongside delivery, and we haven't lost another senior engineer from those teams since."
— CTO, European Payments Provider
Case Study 2: Global E-Commerce Platform
Before Keypup MCP:
2,000 engineers across North America, Europe and India
A post-incident review found two production incidents traced to weekend merges with no approval
An HR-led wellbeing program with no engineering data behind it
After Keypup MCP:
Each region's analysis used its own time zone, which removed the false alarms a single global working-hours window had produced
The merge risk comparison made the case for requiring an approving review on every pull request, including outside working hours
Pull requests merged outside working hours with no approving review fell by 70%, measured by re-running the comparison every month
"Framing it as a team signal, not a personal one, made all the difference. Engineers asked for the dashboard themselves, because it gave them data to push back on unrealistic deadlines."
— VP Engineering, Global E-Commerce Platform
Implementation: Getting Started with Keypup MCP
1. Connect Your Git Platforms
Connect GitHub, GitLab, Bitbucket or Azure DevOps to Keypup. Pull requests, their commits, reviews and merge dates are imported automatically.
2. Agree on Your Definitions — and Your Principles
Decide what working hours mean for each team and which time zone applies. Just as important, agree up front that the analysis is used at team and repository level, that individual results are never shown, and that it is never used in performance reviews. Share those principles with your engineers.
3. Map Teams to Repositories and Time Zones
List which repositories each team owns and where the team works, so each prompt uses the right working-hours window.
4. Connect the MCP Server to Your AI Assistant
Follow the MCP documentation to connect Keypup to Claude, ChatGPT, Cursor or any MCP-compatible assistant.
5. Review the Trend Every Month
Run the health check and the monthly trend to set a baseline. Review the repository scorecard alongside delivery metrics each month, and treat a rising outside-hours share as a reason to revisit scope or staffing — before the attrition report does it for you.
Frequently Asked Questions
Can you measure developer burnout from Git data?
Not directly. Burnout is a human state that no metric captures fully. But sustained after-hours and weekend activity at team level is one of the earliest measurable signals that a team is working beyond its capacity, and it appears months before attrition or engagement surveys reflect it.
Is tracking after-hours commits a form of employee surveillance?
It can be, if it is used to rank or police individuals. Used at team and repository level, with usernames hidden and clear principles shared with engineers, it protects people by giving leaders evidence that a team needs more capacity or less scope.
What is a healthy share of commits outside working hours?
There is no universal benchmark, because flexible schedules and personal preferences vary. The trend matters more than the absolute value: a team whose share rises every quarter, or spikes at every deadline, is borrowing time it will have to pay back.
How do you handle distributed teams in different time zones?
Apply each team's own time zone and working hours in the analysis. Running a single global window will flag every engineer outside that time zone as working after hours, which makes the data useless.
The Bottom Line
You can't see burnout in velocity charts. Keypup MCP shows when the work actually happens, where it spills over and what it costs:
✅ Measuring the share of commits and reviews outside working hours ✅ Seeing when the work happens with a weekday and hour punch card ✅ Tracking the trend and the quarter-end crunches month by month ✅ Finding where work spills over across repositories ✅ Spotting overload patterns without naming anyone ✅ Showing the review shortcuts that late-night merges take ✅ Giving every repository a sustainable pace scorecard to act on
Ready to find out how much your roadmap relies on evenings and weekends? Connect the Keypup MCP Server and ask your AI assistant.
Ready to Transform Your Analytics?
Join teams already using AI to make data-driven decisions faster than
ever.
Your median cycle time looks healthy, yet every release still ends in merge conflicts, rebases and big-bang reviews. Learn what engineering leaders on Reddit say about long-lived branches and the trunk-based vs GitFlow debate at enterprise scale, and how Keypup MCP uses pull request dates, target branches, commits, reviews and mergeability to measure branch lifetime, find where branches live longest and land aging work before it drifts into conflict.
Compare the 6 best engineering metrics tools for multi-team benchmarking in 2026 — Keypup, LinearB, Swarmia, Jellyfish, Faros and Appfire Flow — on cross-team benchmarking, org-level rollups, DORA Metrics, Git-to-ticketing linking, custom KPIs, AI capabilities and data security. See how to compare teams on equal terms and find where your delivery process is broken.
In large engineering organizations, thousands of pull requests are closed without merging or left to go stale every year, and nobody measures the cost. Learn what engineering leaders on Reddit say about abandoned pull requests, and how Keypup MCP uses pull request state, review, size, mergeability and Jira link data to size the PR graveyard, find where work dies, and triage stale pull requests before they are lost.